3) Inventory and potentials
Step three is to provide a comprehensive overview for the initial situation: where is H&C consumed and in what quantities, how is it produced, where is the potential for renewable energy, what is the state of consumers (e.g. the renovation status of the buildings), etc.?
The analysis for the inventory provides an overview of the existing heat demand, the energy sources used and the energy infrastructure (heat grids, gas grids, electricity grids and heat sources).
The analysis provides a baseline from which to compare the potential for the use of renewable energy systems (RES), waste heat and energy efficiency measures (EE) (i.e. building renovations).
The analysis is carried out in five steps described below. First, data is collected that is used to create energy balances. Then a mapping of H&C demand and infrastructure is carried out. This is followed by a potential analysis on renewable energies and energy efficiency, for which maps are also used.
Steps for inventory analysis
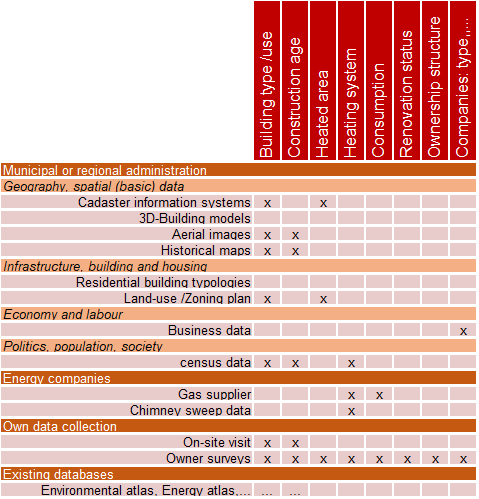
In step 1, a data framework on heating and cooling in the municipality is compiled. E.g. how much energy is consumed? Which energy sources and technologies are used? What is the energy status of the buildings in the municipalities? etc. Below is an example of a data screening, where different data sources are put in the context of their use in heat planning.
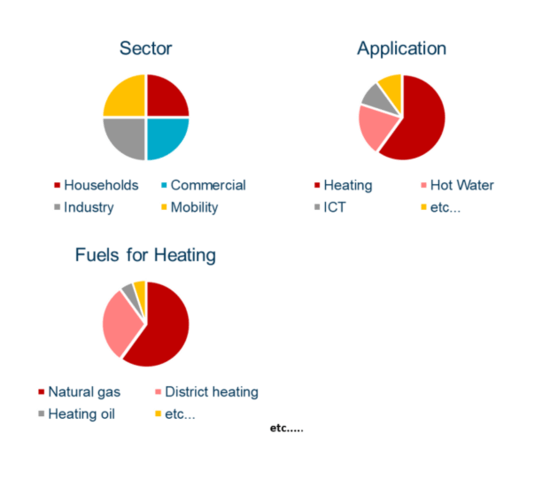
In step 2, energy balances are prepared, differentiated according to consumption sectors, energy carriers and applications. These provide an overview of the status quo. Example diagrams are shown below.
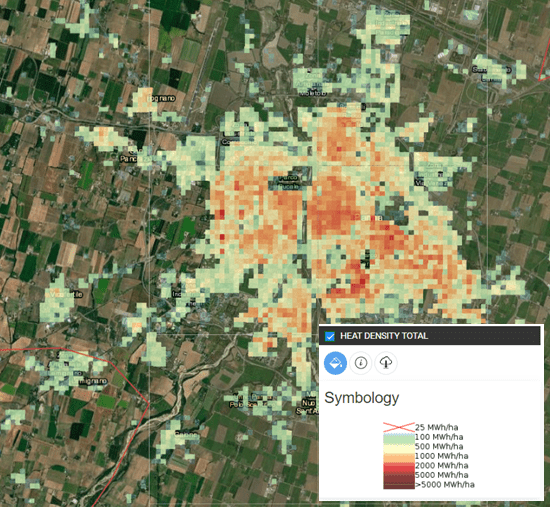
In step 3, H&C demand maps are created and the existing infrastructure and heat generators are mapped.
This step is important for planning, i.e. expanding/setting up heat networks.
Data management (e.g. file formats) and appropriate visualisation must be planned.
The Hotmaps tool (https://www.hotmaps.eu/map) provides open source infrastructure for data storage and visualisation. It can be also implemented on clients’ servers.
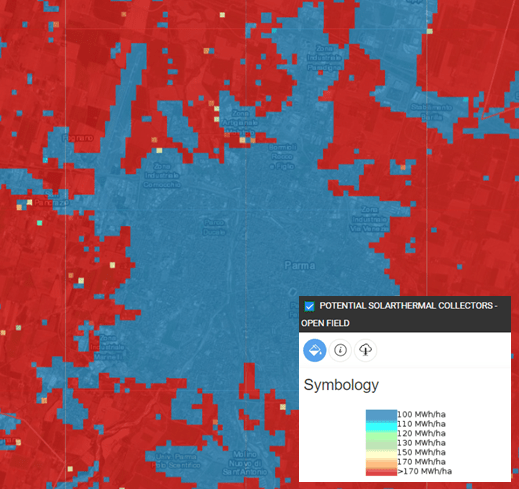
In step 4, the availability of renewable energy for the production of heating and cooling is analysed. E.g. solar thermal and geothermal energy, biomass, excess heat from industry and municipal wastewater.
Information and data from which projects can be directly derived are particularly helpful here. For example, the planning of large scale heat pumps may benefit from knowing which open spaces can be used for solar thermal energy, at which locations geothermal energy is conceivable, or whether waste heat flows or water flows are available.
However, data from public tools such as HotMaps, PETA, etc. can be used as a first point of reference.
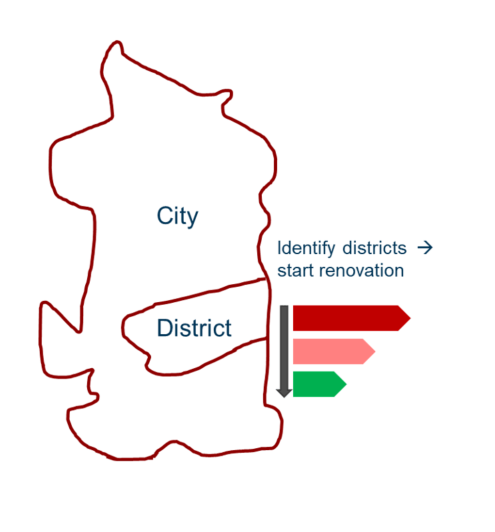
In step 5, the potential for reducing the H&C demand within the municipality is analysed. It is particularly important to characterise the energy performance of the buildings and to identify districts where intensive renovation campaigns should be carried out.
A visualisation in GIS is helpful in this context. Further information on the energy performance of buildings (definitions etc.) can be found in the EU Buildings Stock Observatory (BSO).
Tools and literature for inventory & potentials
Inventory analysis
The EU project Hotmaps collected data on heating and cooling demand for the EU. The data can be used directly or downloaded from the online platform: https://www.hotmaps-project.eu/
The Pan-European Thermal Atlas (Peta) collected data on heating and cooling demand for the EU. The data can be used directly or downloaded from the online platform: https://www.seenergies.eu/peta5/
Another possibility is to use data from housing statistics (e.g. ZENSUS in Germany). However, these still have to be processed for each individual case and combined with characteristic values for energy performance.
Potential analysis
Initial, rough data and potentials for RES and EE in the municipalities can be determined with the help of the public tools listed below. However, these data are only a starting point. A refinement of the data with the help of public administration data, data collection, etc. is usually necessary.
- Several RES-maps: https://www.hotmaps-project.eu/
- Waste heat potential: https://www.waste-heat.eu/
- Photovoltaic Geographical Information System: https://joint-research-centre.ec.europa.eu/pvgis-photovoltaic-geographical-information-system_en
- Potential for geothermal district heating: http://geodh.eu/geodh-map/
- Energy Performance of buildings: https://www.bpie.eu/knowledge-hub/
- Potential analysis of different renewable energies: https://www.hotmaps-project.eu/
- Potential analysis of different renewable energies: https://www.seenergies.eu/peta5/
Subscribe to our Newsletter

This project has received funding from the European Union’s Horizon 2020 research and innovation program under grant agreement No 101033706. The sole responsibility for the content of this website lies with the Act!onHeat project and does not necessarily reflect the opinion of the European Union.


